Pyodide is a distribution of CPython for WebAssembly which was started by Michael Droettboom at Mozilla. Today, Pyodide is an independent open source project.
It not only provides support for calling JavaScript and web APIs from Python, but also brings the Python scientific stack to the browser as it includes the five most essential data science libraries – NumPy, Pandas, Matplotlib, scikit-learn, and Scipy.
In this post, we present a new backend for Matplotlib enabling the rendering of figures in the browser by leveraging the <canvas> element. This showcases how JavaScript and Python can interact with each other, thanks to Pyodide.
Motivation
Supporting libraries in Pyodide requires packaging all of them, along with their dependencies. Unfortunately, the 32-bit WebAssembly specification limits the amount of memory that can be used, and if packages were to use it all, it would be hard to make some space for datasets. Moreover, it can take a long time to download and compile packages when they are first used within the web browser.
To make an effort in this direction – we aimed to reduce the size of the Matplotlib library.
The part of the Matplotlib architecture responsible for defining how pixels are displayed on the screen is called a renderer. Fortunately, Matplotlib allows overriding the default implementation with a custom renderer. Currently, the version of Matplotlib shipped with Pyodide includes a wasm build of the Agg renderer, which is based on the Anti-Grain Geometry (AGG) library. It’s the Agg renderer that draws the plot and an image of that plot is pasted (by extracting the underlying buffer data) onto the web document inside a canvas.
However, web browsers already include tools to render graphics such as the <canvas> element and WebGL. Writing a new backend renderer based on these would enable us to reduce the size and memory footprint of the final build and possibly use GPU acceleration along with giving us the ability to use locally installed fonts with web fonts. In a Google Summer of Code project for 2019, we experimented with rendering graphics directly from Matplotlib using the Canvas API.
Implementing the new Renderer
The Matplotlib library has a layered structure (Scripting Layer, Artist Layer, Backend Layer) and implementing a new renderer requires tinkering with the Backend layer – which is the lowest in the stack.
In essence, it requires us to re-implement some functions that define how primitive stuff is rendered:
- draw_path: for drawing lines, curves (both quadratic and bezier), etc.
[when plt.plot(), or plt.scatter() is called, etc.] - draw_image: for rendering images [when plt.imshow() is called, etc.]
- draw_text: for drawing headings, axis markings, etc. along with mathematical text
- draw_markers: for drawing axis ticks
and others…
In addition to the above, styles and various properties such as join-style, cap-style, line-width, dashes, etc also need to be set.
Recall that Pyodide supports seamless data sharing with JavaScript and also gives the user the whole DOM available on the Python side. This essentially enables us to call functions of the <canvas> element (responsible for actual rendering) – all inside Python!
Challenges
- Rendering Text:
The Matplotlib library provides functionality for looking up fonts that it ships with. Unfortunately, these fonts are not accessible to the web browser to draw onto a canvas. We need to provide a way to load custom fonts that the browser can use. Thus, a simple assignment like the one below doesn’t work.
from js import document
canvas_element = document.getElementById("canvas")
ctx = canvas_element.getContext("2d")
ctx.font = “30px cmr10”
The cmr10 font is available inside Matplotlib’s virtual file system but is not accessible to the browser and thus, the <canvas> element cannot use it and falls back to using a default placeholder font.
This problem is solved using Web Fonts which allows us to asynchronously load fonts with JavaScript and make them available to the browser. Once the “correct” font is loaded, we can request Matplotlib to redraw the plot with the correct font. Again, all of this can be done inside Python since Pyodide can interact with browser APIs and other JavaScript libraries at a very fine level.
However, as easy as it sounds, keeping track of when the font is loaded (so as to request a redraw) is not so trivial. The FontFace API is asynchronous and relies on the network while draw_text() in matplotlib is synchronous – making things harder due to the following problems:
Matplotlib can call “draw_text()” multiple times in a single drawing instance – each of them requesting the “correct” font to be loaded. It’s possible that a previous request for asynchronously loading the correct font isn’t completed yet (still fetching from the network), and a new request has been made at that time. This creates the problem of multiple font loading due to queued and concurrent invocations of the
FontFace API and affects performance.Drawing a plot from the Matplotlib library leads to calling “draw_text()” which leads us to using the FontFace API to asynchronously load the font which leads us to request a redraw which further calls “draw_text()” and leads us to calling the FontFace API again which then requests the redraw again…
In short, it’s an infinite recursion ofload font → redraw → load font → redraw → ....
The above problems are similar but have a subtle difference amongst them. The first problem occurs for a single draw event (due to multiple “draw_text()” invocations in that draw event), while the second problem leads to multiple never-ending redraws. In general, these issues are related to Python not being able to do synchronous I/O operations when the underlying JavaScript APIs are asynchronus (https://github.com/pyodide/pyodide/issues/1503).
Fortunately, both of these can be fixed using a global state which keeps track of what fonts have already been loaded into the browser’s environment. This way, we only load fonts that are not present in this state.
- Rendering Images and Transparent Pixels:
Images are essentially represented as multi-dimensional arrays and can be manipulated by the NumPy library on the Python side. The <canvas> element however needs the ImageData object.
Pyodide enables conversion of data types to and fro from JavaScript. Specifically, a bytes object in Python can be implicitly converted to a Uint8ClampedArray in JavaScript which is exactly what we require to create an ImageData object.
# im: (N, M, 4) array-like of np.uint8 i.e. an array of RGBA pixels.
import numpy as np
from js import document, ImageData
from pyodide import create_proxy

# converting numpy array to an ImageData object
# through Uint8ClampedArray representation
h, w, d = im.shape
im = np.ravel(np.uint8(np.reshape(im, (h * w * d, -1)))).tobytes()
pixels_proxy = create_proxy(im)
pixels_buf = pixels_proxy.getBuffer("u8clamped")
img_data = ImageData.new(pixels_buf.data, w, h)

# rendering the ImageData object onto a canvas element
canvas_element = document.createElement("canvas")
canvas_element.width = w
canvas_element.height = h
ctx = canvas_element.getContext("2d")
ctx.putImageData(img_data, 0, 0)

# clean-up
pixels_proxy.destroy()
pixels_buf.release()
The above snippet showcases how the conversion from Numpy array to a raw bytes representation when interpreted as a Uint8ClampedArray in JavaScript can be used to render the ImageData object using the putImageData() function. Although it does the job for us, it has it’s own issues:
Image-data which is pasted doesn’t care about transformations. Thus, even if the canvas is transformed using operations such as rotate(), scale(), translate(), setTransform(). The resulting image would appear the same as if the canvas was not transformed at all.
If for some reason, the ImageData object contains some transparent pixels, and the canvas already has a red background, the transparent pixels will replace the red pixels which is not what we usually expect. We usually expect transparent pixels to blend with the background i.e. the pixels remain red at positions where pixels of the incoming ImageData object are transparent. But, this is not what happens, the previous pixels are simply over-written.
To overcome the above 2 issues, we use the “drawImage()” function in addition to the “putImageData()” function. The “drawImage()” function doesn’t suffer from the above two issues but it expects another canvas element as it’s input instead of an ImageData object. Thus, to use them in tandem we require something known as an In-memory canvas.
An In-memory canvas is a normal <canvas> element which is used for off-screen rendering which is about rendering content somewhere, but the screen. That “somewhere” means the memory. Thus, we render graphics to the memory.
To achieve this, we create a <canvas> element, but we do not link it to the DOM and thus its content won’t be visualized onto the screen. Once we have rendered something to the off-screen canvas, it’s content can be used in another canvas element (which will NOT be off-screen and will be linked to the DOM).
To make this possible — the function putImageData() is used for off-screen rendering. This is used to put an ImageData object into an off-screen canvas. Once that is done, the on-screen canvas can now use the drawImage() function — to copy the contents of the off-screen canvas and render that stuff to the screen.
While the long process of rendering to off-screen and then transferring its data to on-screen using “drawImage()” seems like overkill, it helps us avoid the 2 issues regarding transformations and transparency we discussed above.
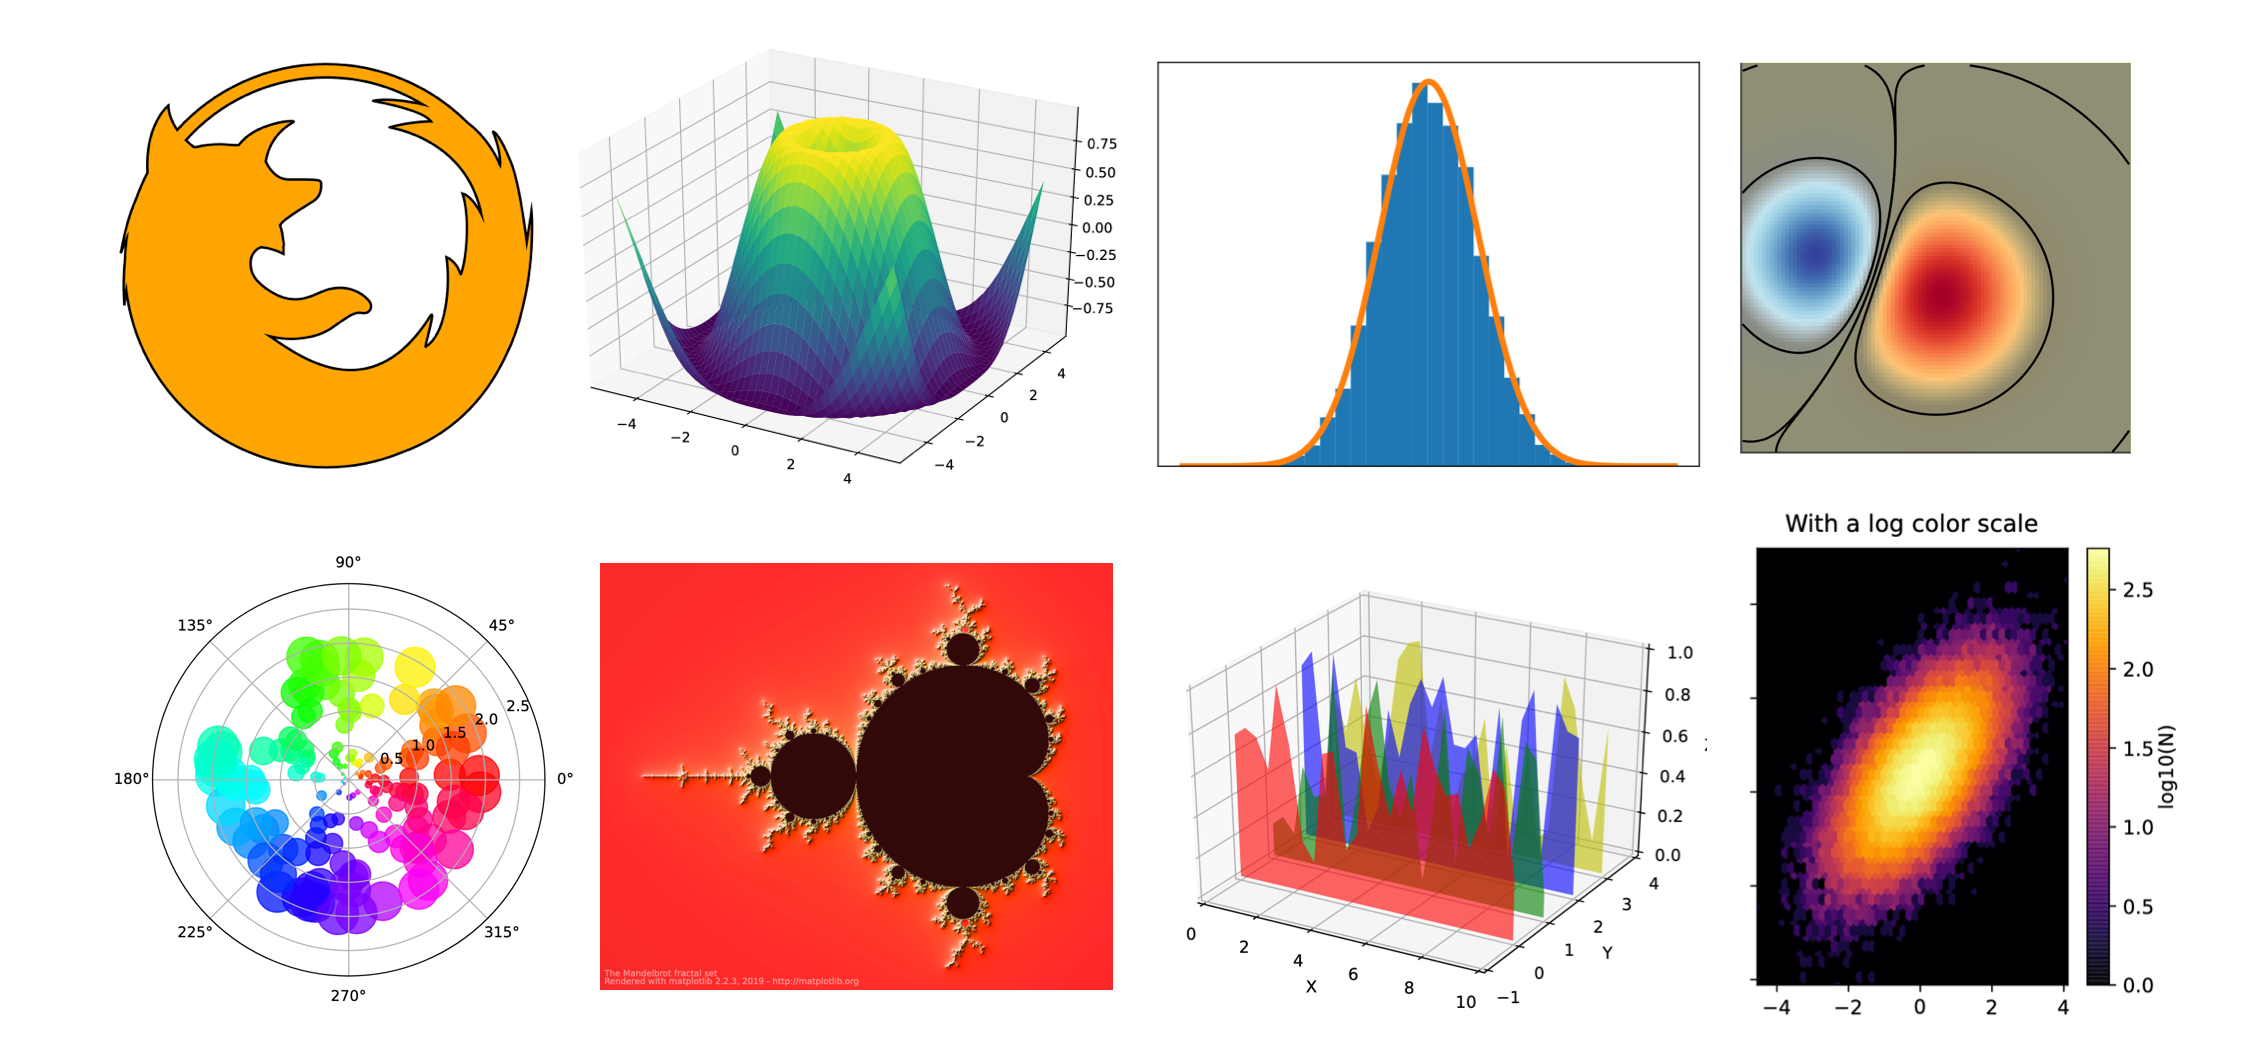
Results
With the above major issues fixed, the new backend is ready. Here are some sample plots (taken from the Matplotlib gallery) that are rendered using the new canvas based backend.
To use the <canvas> backend in your own projects, please use the following statements at the top of your script.
import matplotlib
matplotlib.use("module://matplotlib_pyodide.html5_canvas_backend")
You can find a more complete example of plotting with matplotlib WASM backend on JSFiddle.
How Fast is it? and Potential Optimizations
Using the Canvas API to draw the plots live introduces a performance penalty. We assume this is due to iterating over all of the points on a curve in Python, since loops in Python are known to be slow. Further, loading fonts asynchronously over the network can take some time. However, Rendering Images is as fast as before. Below are the benchmarks for the new Canvas based renderer compared to the default Agg renderer for 5 sample plots in both firefox and chrome.
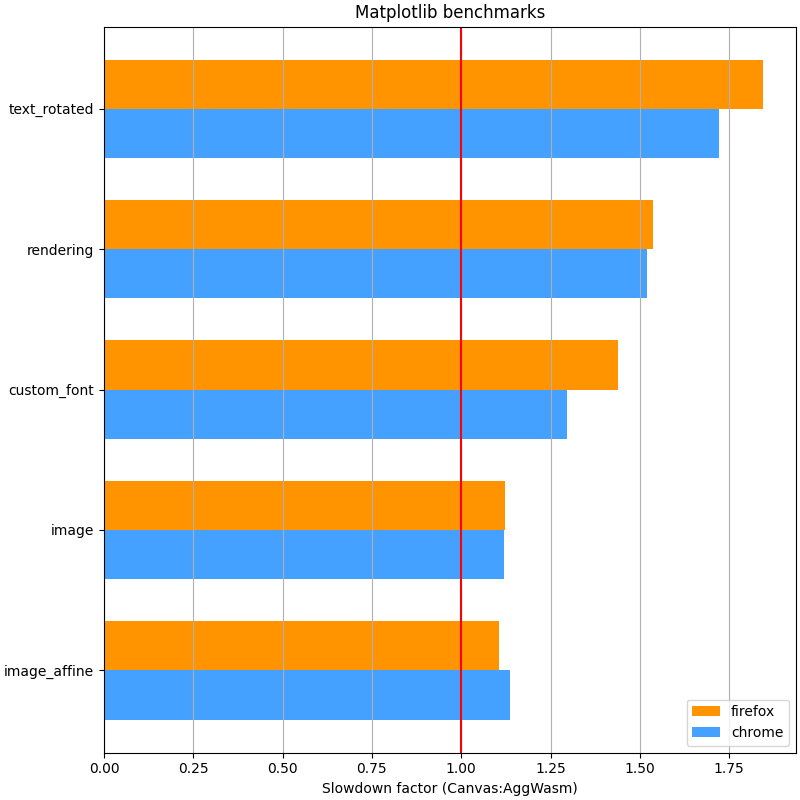
In essence, the new renderer is about 1.25 to 1.5x slower but that’s the price one pays for reducing the size.
To overcome the above slowdown due to the rendering loop in Python, one solution is to rewrite this time-critical piece in JavaScript. This can be possible using the Function construct in JavaScript. The Function construct would essentially allow us to create JavaScript functions inside a Python module capable of accepting and working with pythonic arguments.
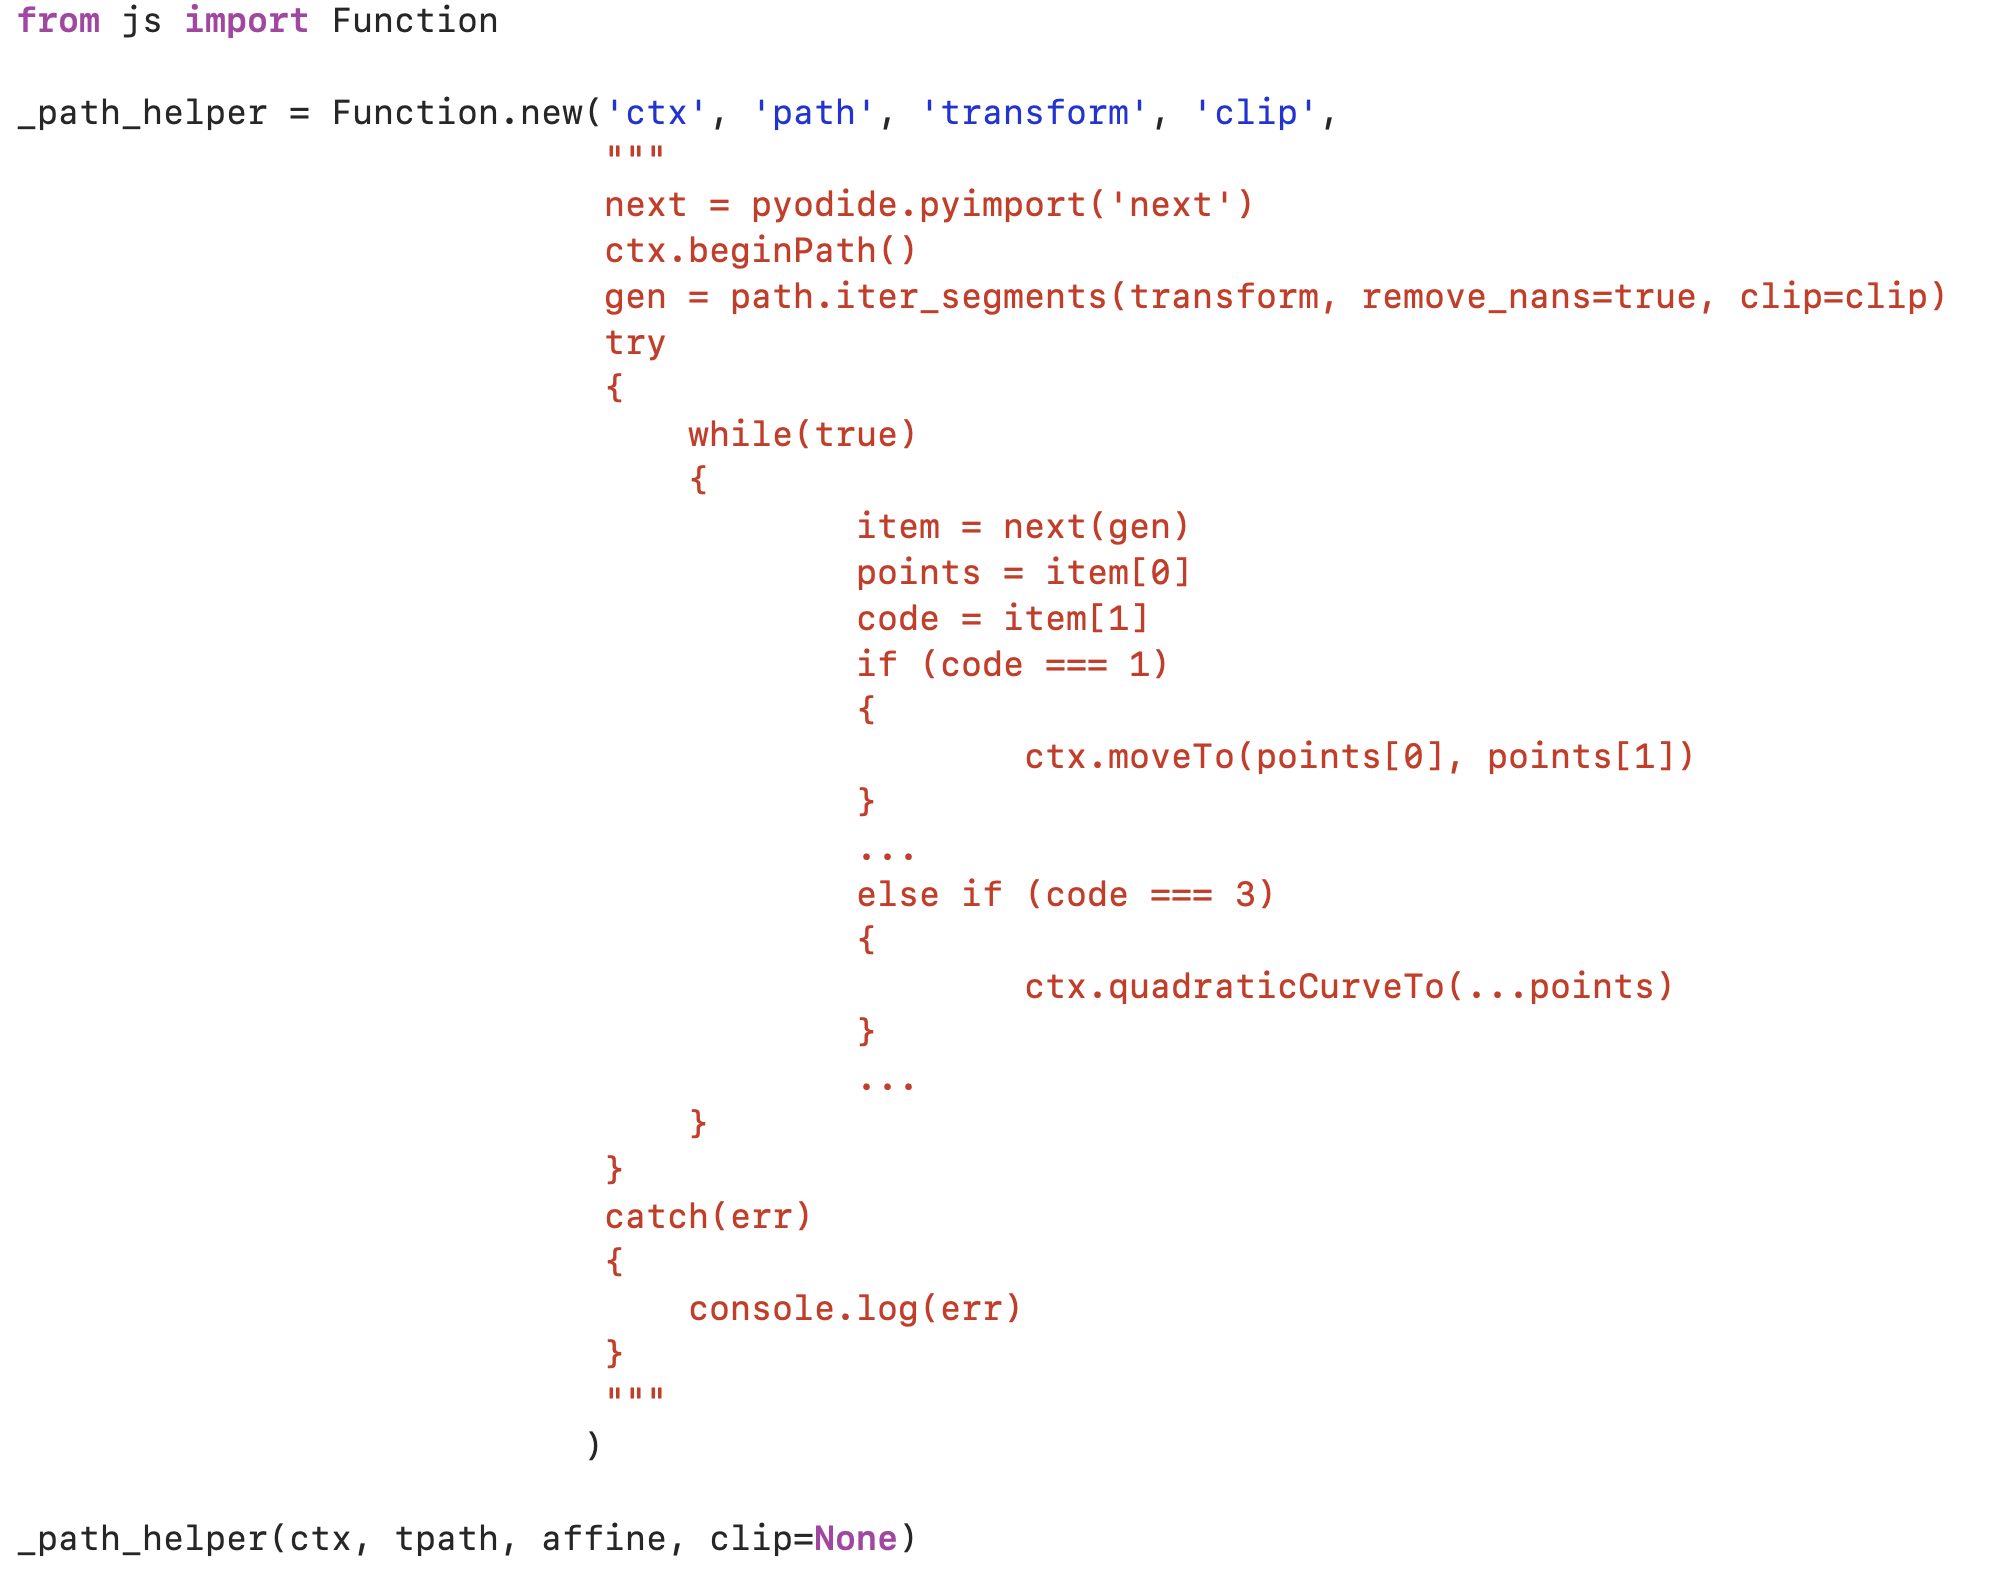
The above snippet defines a JavaScript function _path_helper which accepts Pythonic arguments and also supports calling of pythonic object’s methods inside it – path.iter_segments(). The work related to this was attempted here: https://github.com/pyodide/pyodide/pull/510
Conclusion
It’s been really gratifying to see all of the cool things that have been created with Pyodide in the few years since its public launch. However, there’s still lots to do to turn this proof-of-concept into a professional tool for everyday data science work. If you’re interested in helping us build that future, come find us on Gitter, Github and our mailing list.
About the Author
Madhur Tandon is a Scientific Software Engineer at QuantStack. He completed his Bachelors in Computer Science from IIITD. He is active in the open source ecosystem and has worked with Elucidata, INCF, TCS Research, Mozilla, Deepnote, etc. in the past. Besides core data science and machine learning, he is interested in tools that enhance a data scientist’s workflow and the scientific software ecosystem. This work was initially done as a part of the Google Summer of Code program, under the supervision of Michael Droettboom at Mozilla and was later revived as part of my role at QuantStack, with support from Roman Yurchak. Madhur has also contributed to the JupyterLite project (a Jupyter distribution that runs entirely in the browser and provides a Pyodide-based Python kernel) which was also developed at QuantStack. Finally, he has been a speaker at conferences such as PyData and JupyterCon, etc. Talk to him about his solo trip to SF, his previous experiences, or about books and food. When not working, he is working out!
Huge thanks to Michael Droettboom, Roman Yurchak, Sylvain Corlay and the whole Iodide team (Brendan Colloran, Hamilton Ulmer, William Lachance and others), for making this happen!